This concludes a series of three Medical Physics projects I undertook at University. The project is preceded by the first and second projects.
This project was worth 1/3 of my Masters degree in Physics (4th year). As well as presenting my work in a 30 minute Viva, I produced a 34,500 word dissertation (165 pages), and an additional 1,100 word (8 page) summarised report. The summarised report is published here.
1 - Abstract
Virtual environments have been developed to enable treatment of Visual Vertigo (VV) in Virtual Reality (VR). The Oculus Rift DK2 (DK2) is used to view the environments. Tracking data from the headset is recorded for analysis using custom analysis tools. To run the environments, a powerful PC was built with a GTX 1070 and i7-6700.
2 - Introduction
This report summarises a full dissertation [1] on treatment of VV through use of VR. For the full context, please see the full dissertation.
The dissertation follows on from previous work, where VR environments were built to facilitate patient treatment inside VR. In this project; existing environments have been modified, analysis tools have been developed to enable compliance testing and data analysis, and custom hardware has been built to run the bespoke software. These events are summarised in this report.
3 - Grades
The VR environments contain varying levels of visual stimuli, and are known as grades. A higher grade of environment is more visually stimulating. There are eight grades in a park environment, and eight grades in a beach environment. Visual stimuli is primarily increased with leaves, rain, flying birds; and trees that move in the wind. For full details, please see the dissertation [1]. The current beach environment is shown in Figure 1, and the park environment in Figure 2.
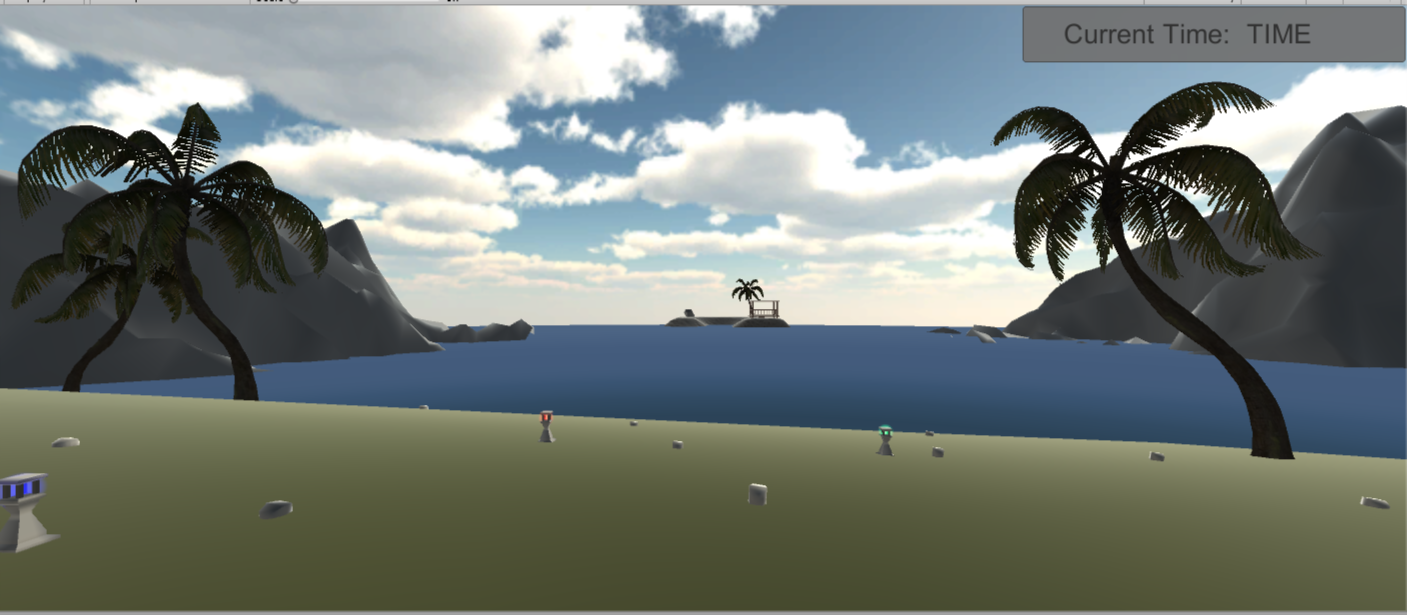
Figure 1: Beach Environment
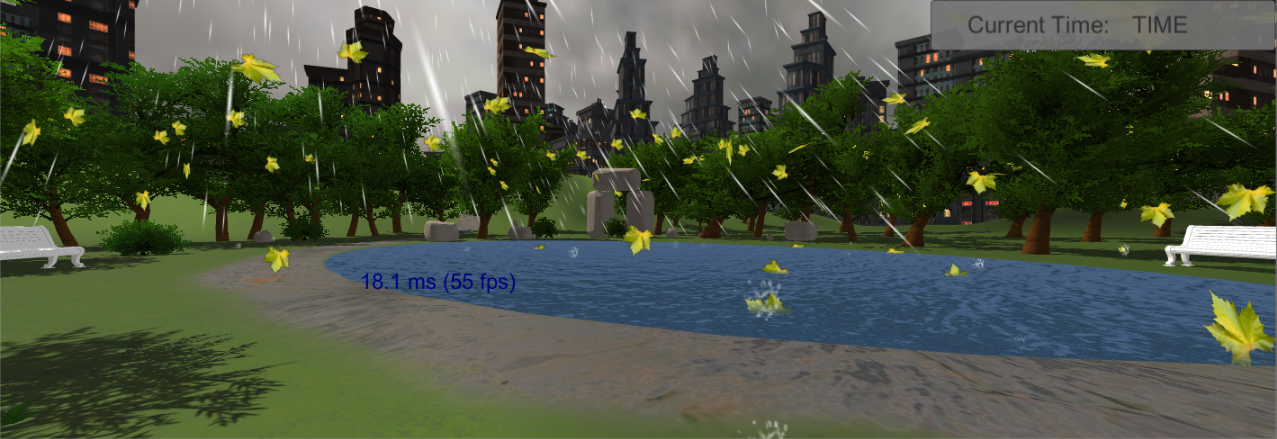
Figure 2: Park Environment
In addition, an optokinetic grade was developed, taking place in the beach environment. This grade moderates visual stimuli with movement of a striped wall, which is controllable by the clinician. This grade is called “Grade_Optokinetic”, and is shown in Figure 3. In total, there are 17 grades.
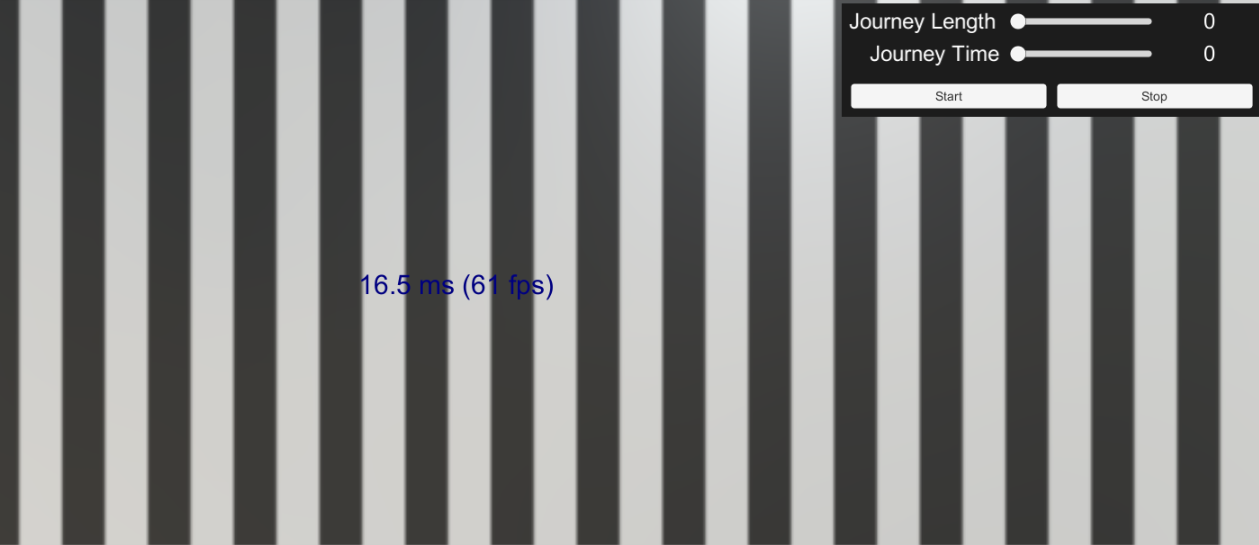
Figure 3: Grade_Optokinetic
In all grades, the patient wears the DK2 VR headset; though all grades are compatible with both SteamVR and Oculus. The headset has tracking data; a position and rotation in 3D space. Tracking data is captured at 120Hz for later analysis and compliance testing. This functionality is achieved through the Analysis Tools, known as “Transform Data Processor” and “Grade0_Player”.
4 - Transform Data Processor
Transform Data Processor (TDP) is an application built to analyse tracking data from the grades. This application was developed using the Universal Windows Platform (UWP), and as such runs only on Windows 10. TDP allows the user to open one tracking file in isolation, or many files at once to compare them. The application also allows comparing time slices of data, so that performance in a particular exercise can be compared across treatment sessions. These analyses generate graphs and statistics to show trends in the tracking data which could correlate with the patient’s condition. See the application in Figure 4. For the full functionality, please refer to the “Help” tab in the application itself, where full usage instructions are provided. For a full discussion of this tool, please see the dissertation [1].
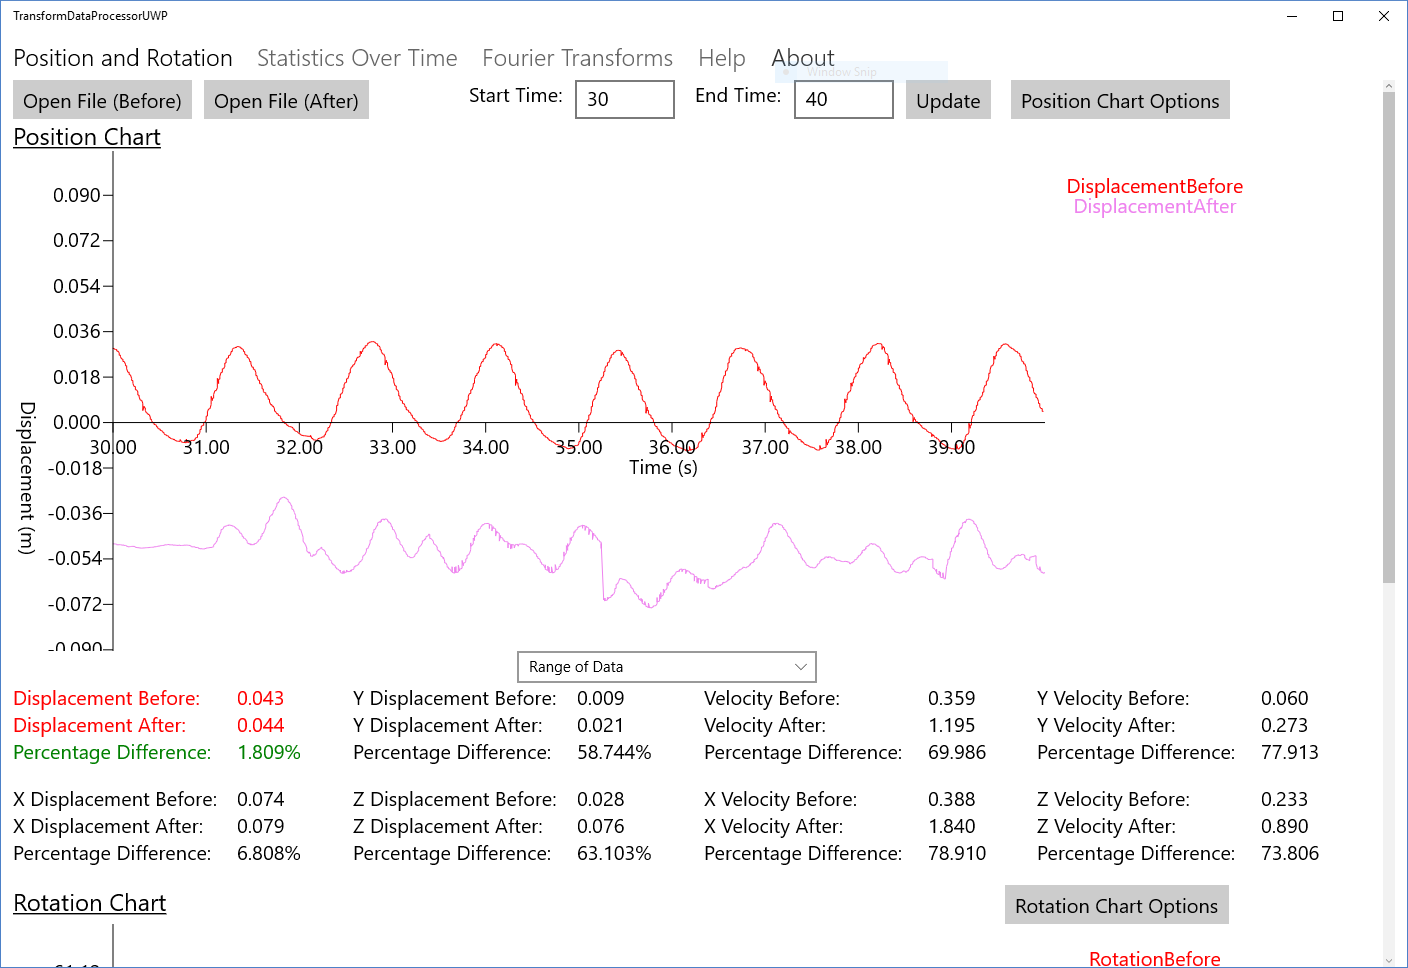
Figure 4: Transform Data Processor
Figure 5: Tracking Data
Figure 6: FFT of Tracking Data
5 - Grade0_Player
This application enables compliance testing in the clinic by permitting clinicians to replay the patient’s movements from the treatment session. The movements are reconstructed from the tracking data. See the application in Figure 7.
Clinicians can select files to play back from the drop-down in the top left, and playback can be precisely controlled using the slider and buttons at the bottom, along with keyboard shortcuts. The patient’s head is represented by a red cube, and their gaze by a red line extruding from that cube. Furthermore, the clinician can fly through the environment using a keyboard and mouse to gain optimal positioning. Full help text is available through a help menu in the bottom right corner of the window. This application is viewed on a monitor rather than in VR.
It’s important to note that the red line shows only where the headset itself is pointing, and not necessarily where the patient is looking. This is because the patient’s eyes are not tracked within the headset. For a full exploration of this tool, please see the dissertation [1].
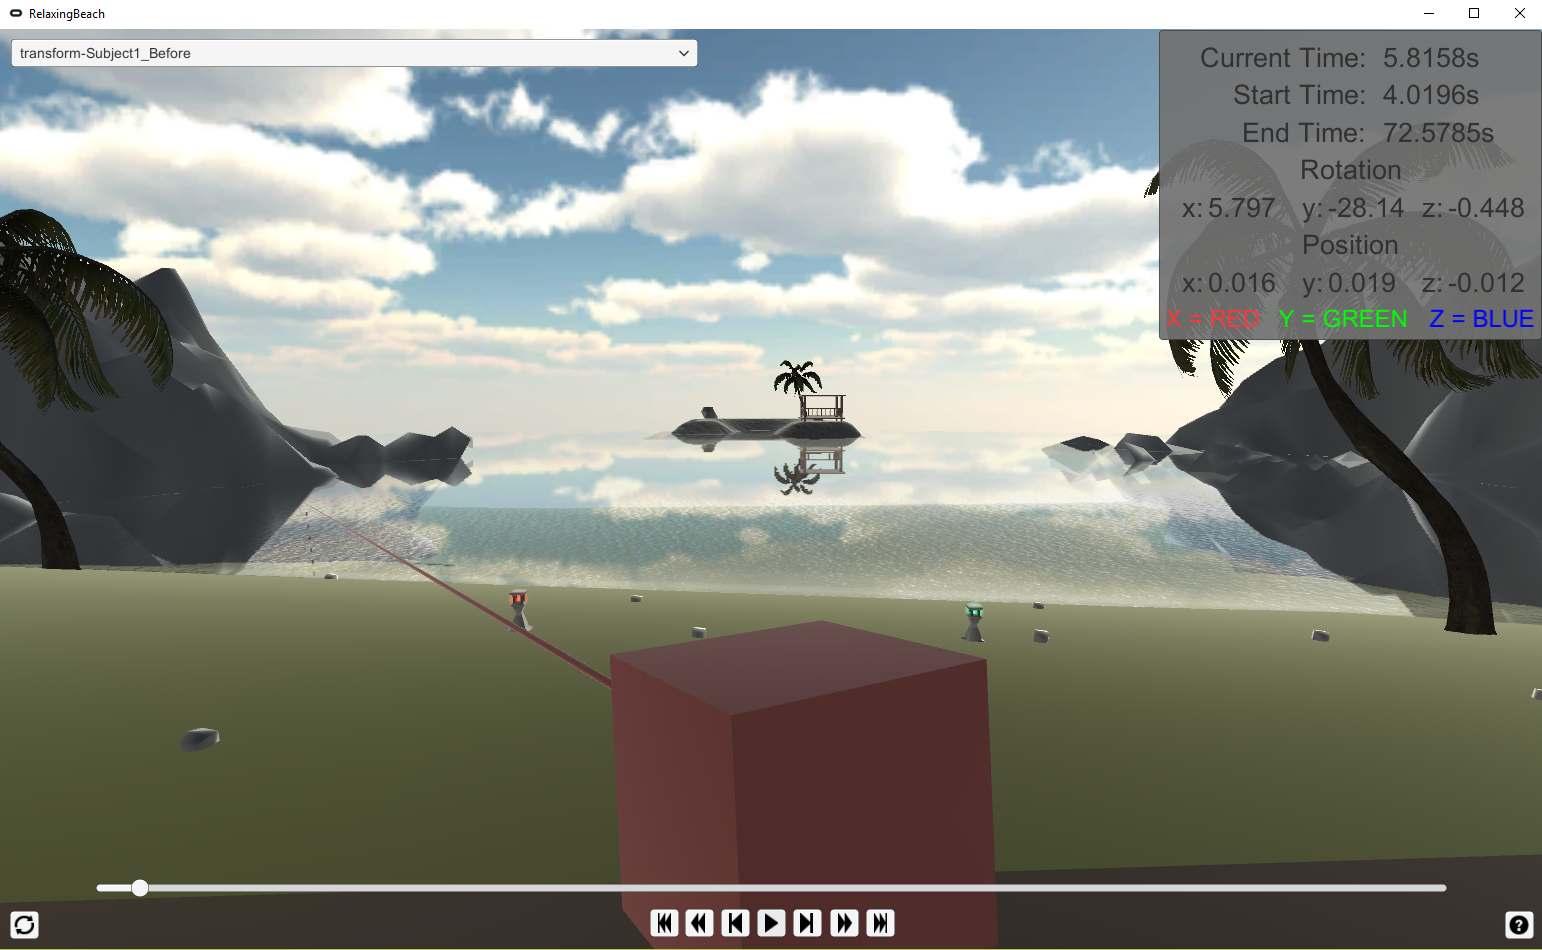
Figure 7: Grade0_Player
6 - Hardware
With bespoke software developed, suitable hardware was required to run it. This consists mainly of the VR headset and the PC itself. The VR headset used is the Oculus Rift DK2 (Figure 8). The HTC Vive was recommended as a better system for future applications.
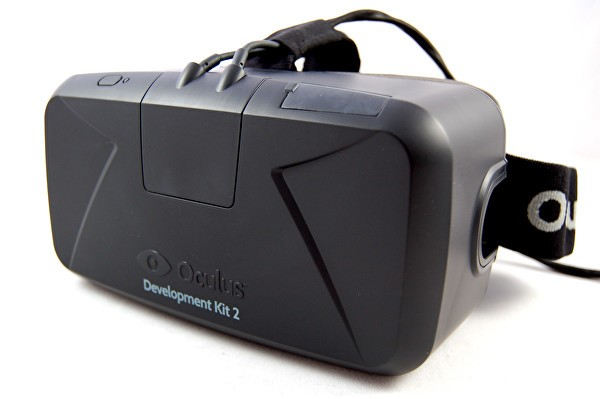
Figure 8: Oculus Rift DK2
The PC was built to provide a high-quality VR experience. See the completed build in Figure 9, with the side panel removed for visibility. In brief, it features 16GB of Vengeance DDR4 RAM, an i7-6700 and a GTX 1070. It uses a high-quality Corsair RM650i power supply with 350W headroom to allow future expansions, and to provide optimal power efficiency at current maximum load (91% at 300W). To provide a responsive user experience, a Corsair Force SSD is used. To minimise noise at the request of clinicians, a Noctua NH-U12S is used, which is a high-quality, low-profile heatsink for the CPU. Furthermore, the variant of GTX 1070 used is the Palit JetStream, for which the fans do not spin below 50C. This build benchmarks 50% above the Oculus recommended spec in FireStrike 11 (~14k points scored), which is a benchmark representative of general gaming performance.
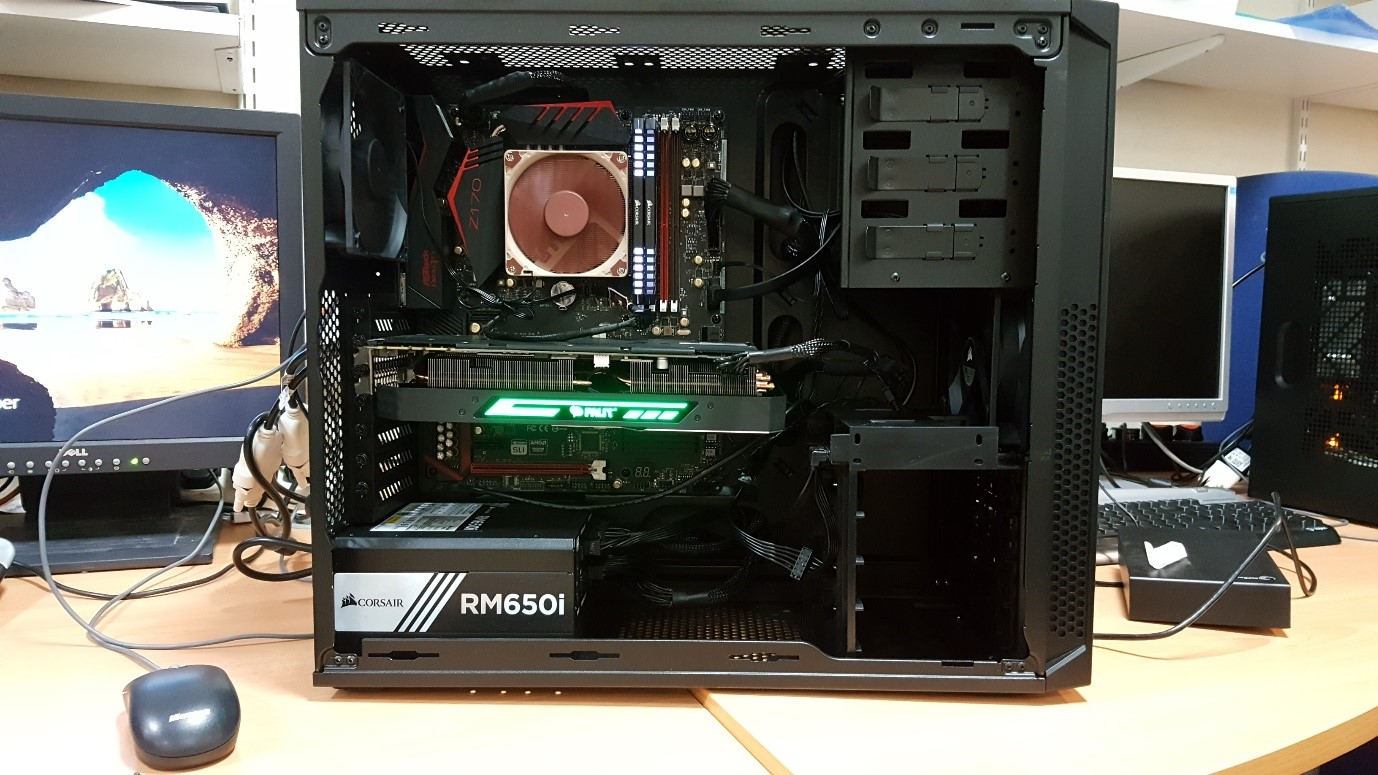
Figure 9: The PC
7 - User Guide
A user guide was required to operate the bespoke hardware and software. This user guide was provided to the clinicians, and describes the setup process in detail. Additionally, it walks the user through the steps for treating a patient using the system, and provides recommended practices for data management. It details installation of TDP and interpretation of the data, however usage instructions are provided within TDP itself.
8 - The Clinic
The hardware and software discussed thus far has been delivered to clinicians for testing in clinical trials. The clinicians have used these products to treat patients inside VR, and plan to use a combination of data from the grades, as well as established questionnaires, to assess patient progress.
9 - Conclusion
In this project, bespoke hardware and software has been developed to enable patient treatment of Visual Vertigo inside Virtual Reality, and analysis of their progress. Whilst clinical trials have concluded, data from treatment sessions has not yet been analysed. Analysis of this data would be a good next-step.
10 - Works Cited
[1] L. Foot, “Enhancing Treatment of Visual Vertigo Through Use of Virtual Reality,” The University of Sheffield, Medical Physics, Sheffield, 2017.
[2] L. Foot, “A QUANTITATIVE APPROACH TO PATIENT TREATMENT OF VISUAL VERTIGO IN VIRTUAL REALITY,” The University of Sheffield, Medical Physics, Sheffield, 2016.